mirror of
https://github.com/opengeos/GeoLibre.git
synced 2026-11-04 10:43:36 +00:00
 Qiusheng Wu
38ed979d3b
* docs: review the docs against the code and fix drift

Check every docs page against the current code and correct what no
longer matches: menu paths and labels, plugin placement (most plugins
now open in a docked panel), Cesium ion tokens being optional, desktop
OAuth sign-in for sharing, browser project save/open, project schema
fields, server and collaboration endpoints, Python and MCP APIs, and
stale paths in the source-code deep dives.

Fix the Spatial SQL tutorial's ST_Area_Spheroid query, which needs
ST_FlipCoordinates for lat/lon axis order. Document the Settings
sections that were listed but never described (Language, Appearance,
Interface, Geocoding, AI Providers), and add the USGS NLDI and ArcGIS
feature editing pages to the nav.

* docs: keep the NLDI and ArcGIS editing pages out of the nav

* Address CodeRabbit review feedback

- collaboration.md: give both snapshot-cap defaults, 10 MB for the
  relay and 1 MB in the Docker Compose setup.
- features.md, cesium-renderer.md: without an Ion token the globe still
  gets terrain from keyless Terrarium elevation (or a configured COG),
  not a bare ellipsoid (cesium-engine.ts enableWorldTerrain).

* Address CodeRabbit review feedback

- project-format.md: type blankBackgroundColor and selectedLayerId as
  string | null, matching ProjectFile in packages/core/src/types.ts.
2.8 KiB
2.8 KiB
Your First Map
This tutorial takes you from an empty workspace to a styled map with inspectable data, in a few minutes. You can do all of it in the live viewer.
1. Open GeoLibre
Open web.geolibre.app, or launch the desktop app. You start with a basemap and an empty Layers panel.
2. Add a layer
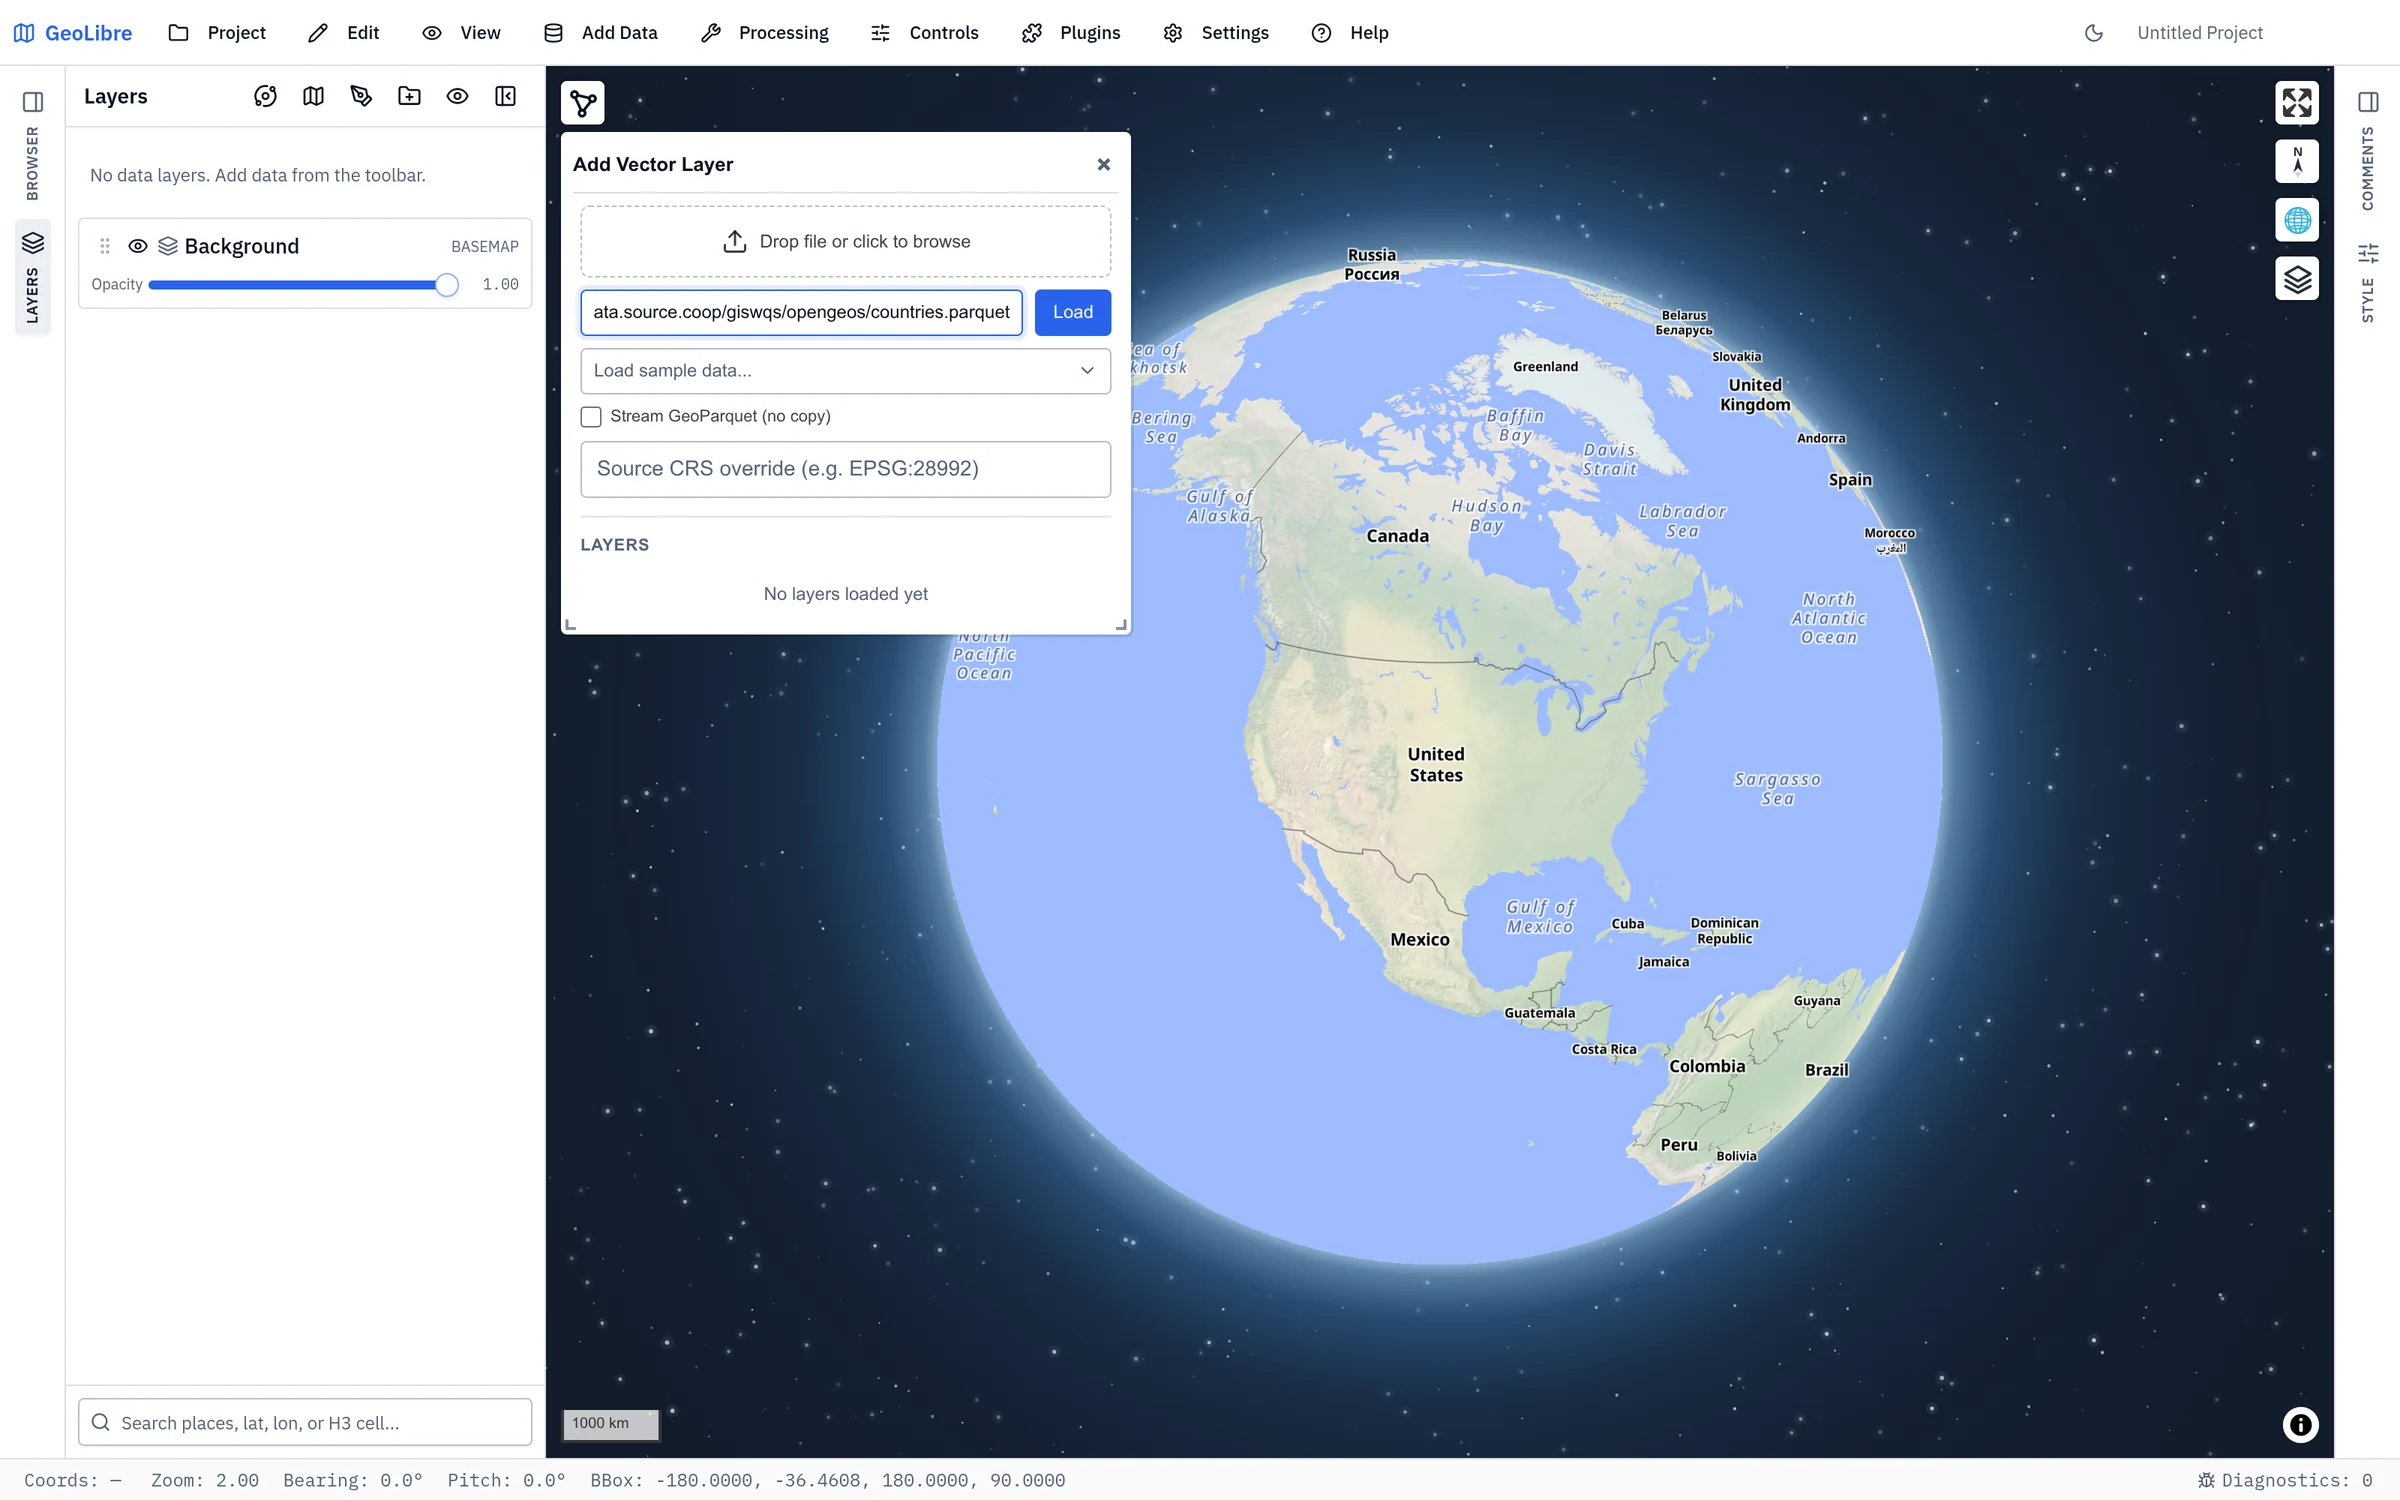
- Open Add Data → Vector Layer.
- In the Add Vector panel, enter a vector URL. You can use the sample countries dataset:
https://data.source.coop/giswqs/opengeos/countries.parquet - Click Load. The countries appear on the map and a
countrieslayer is added to the Layers panel.
See Adding Data for every supported source.
3. Style the layer
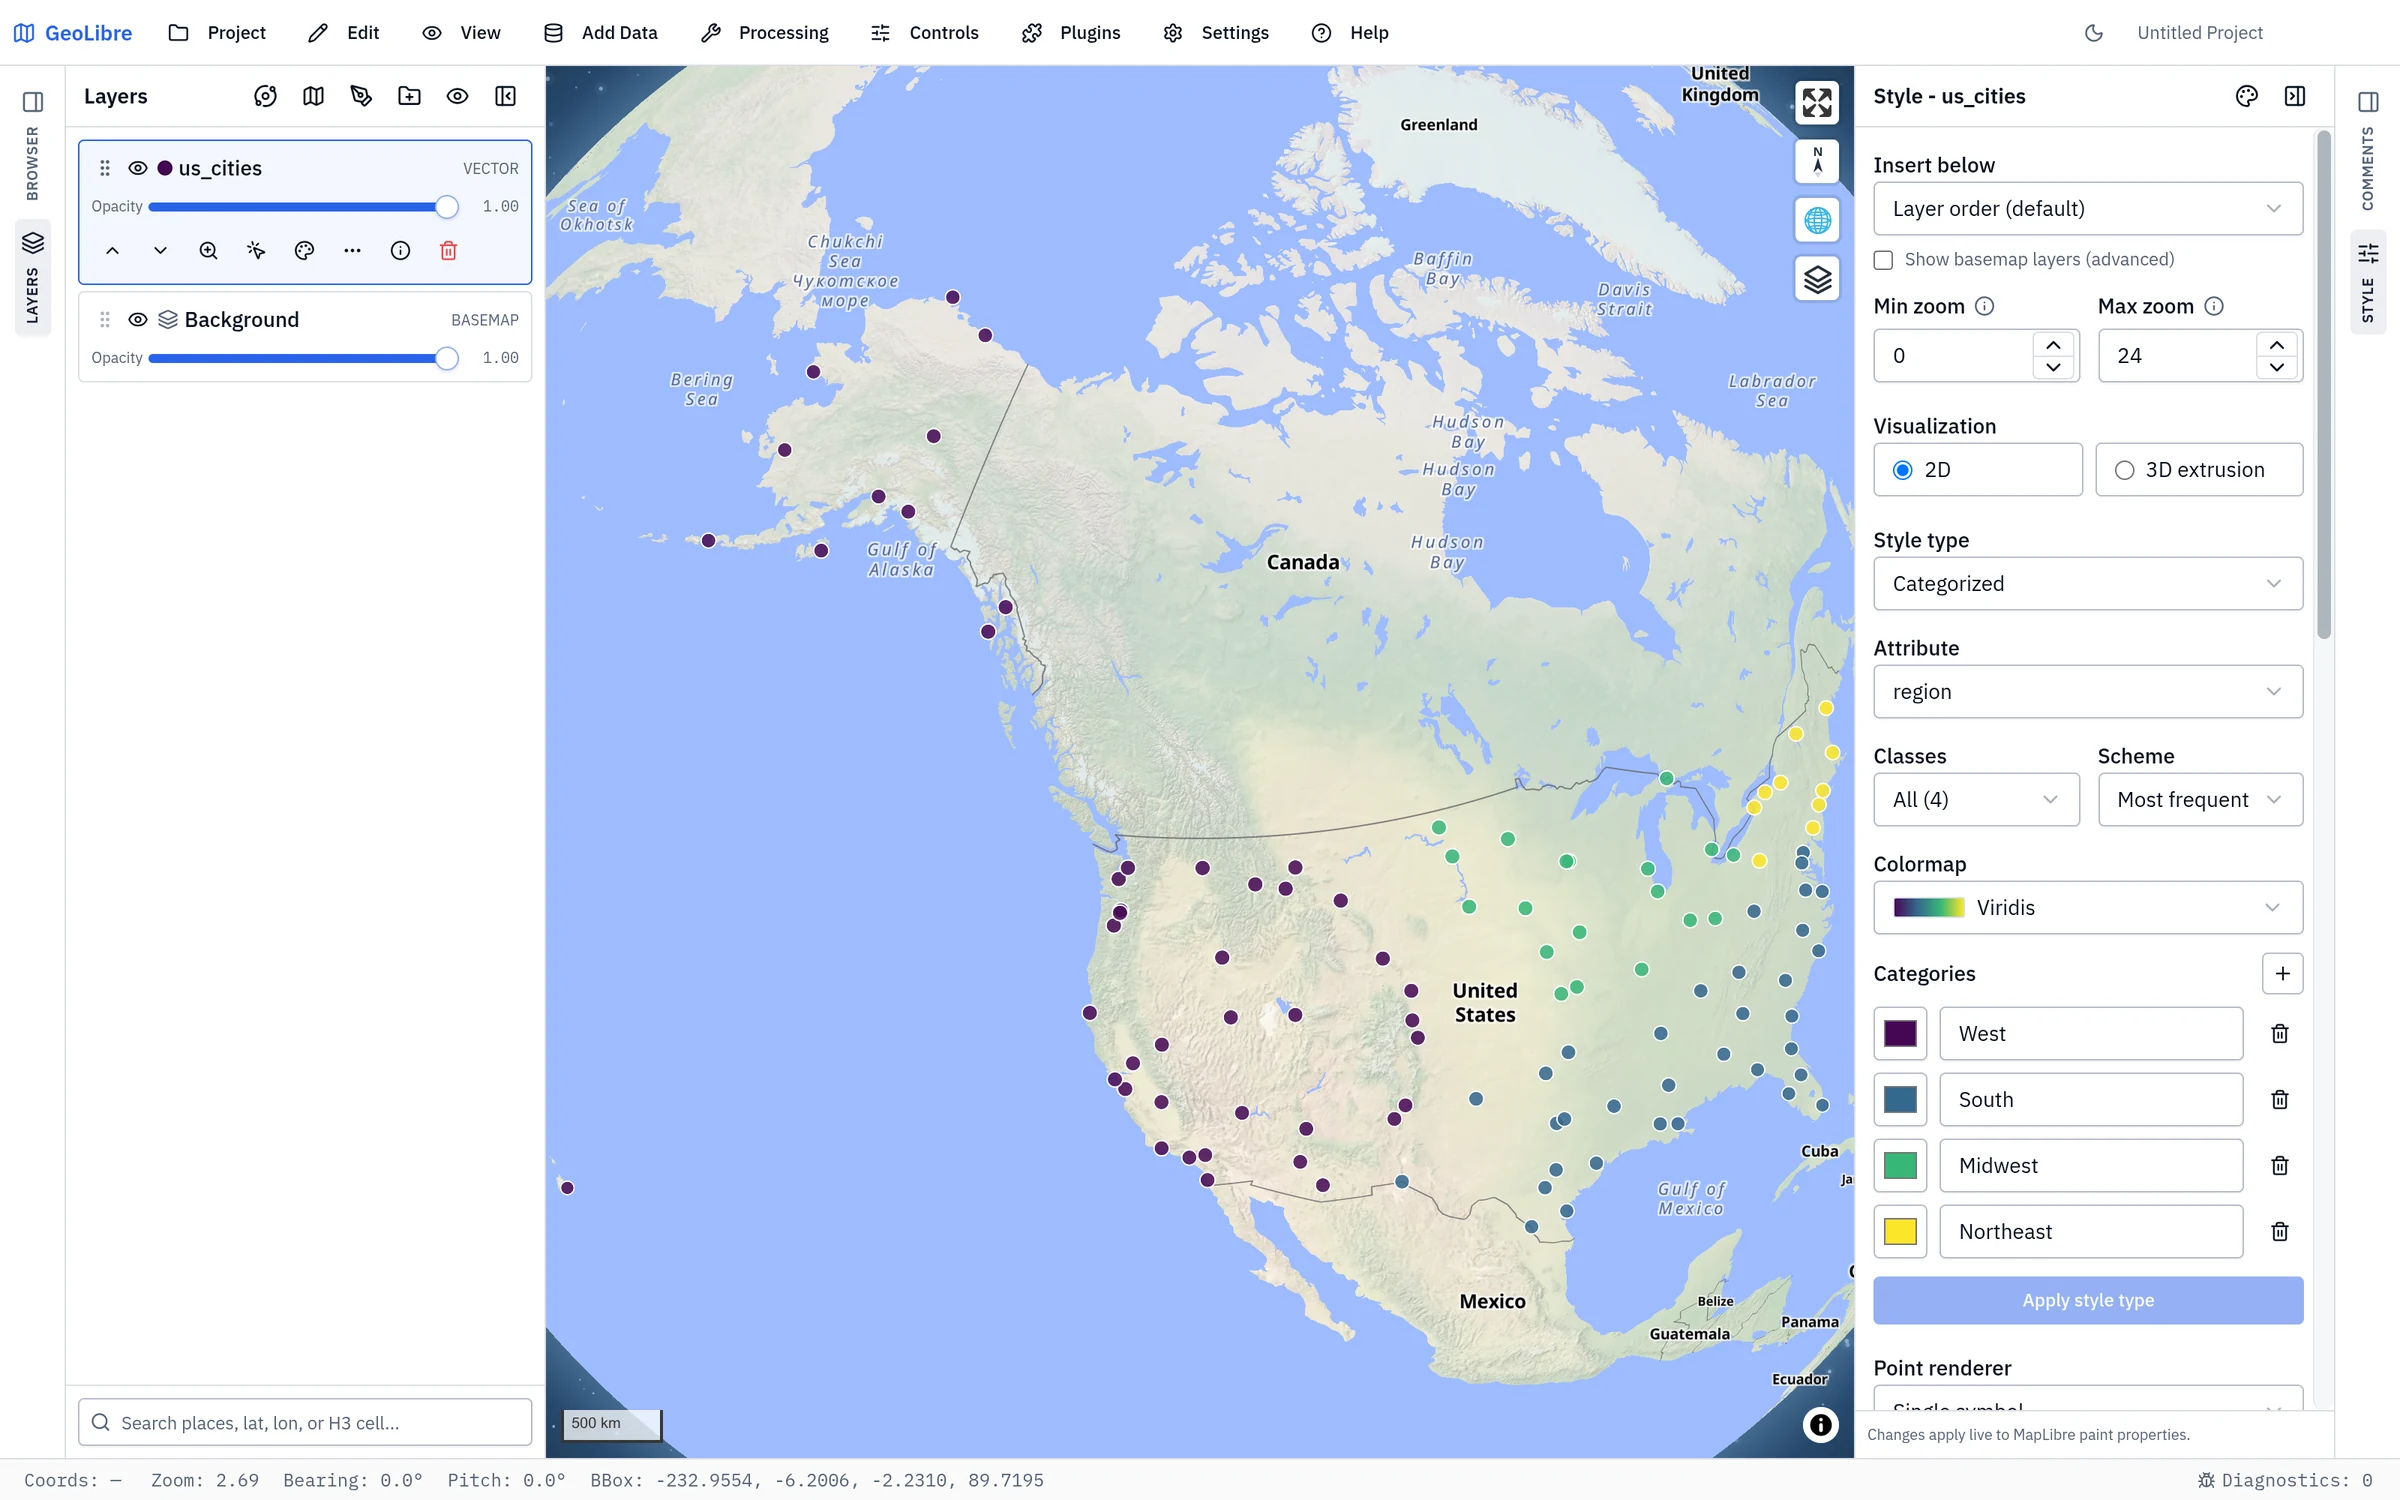
- Select the
countrieslayer in the Layers panel, then expand the Style panel on the right if it is collapsed. - Adjust the Fill color, Outline color, and Fill opacity to taste.
- To make a choropleth, set Style type to Graduated, pick a numeric Attribute (for example
POP_ESTorGDP_MD_EST), choose the number of Classes, a Scheme, and a Colormap, then click Apply style type.
4. Inspect the data
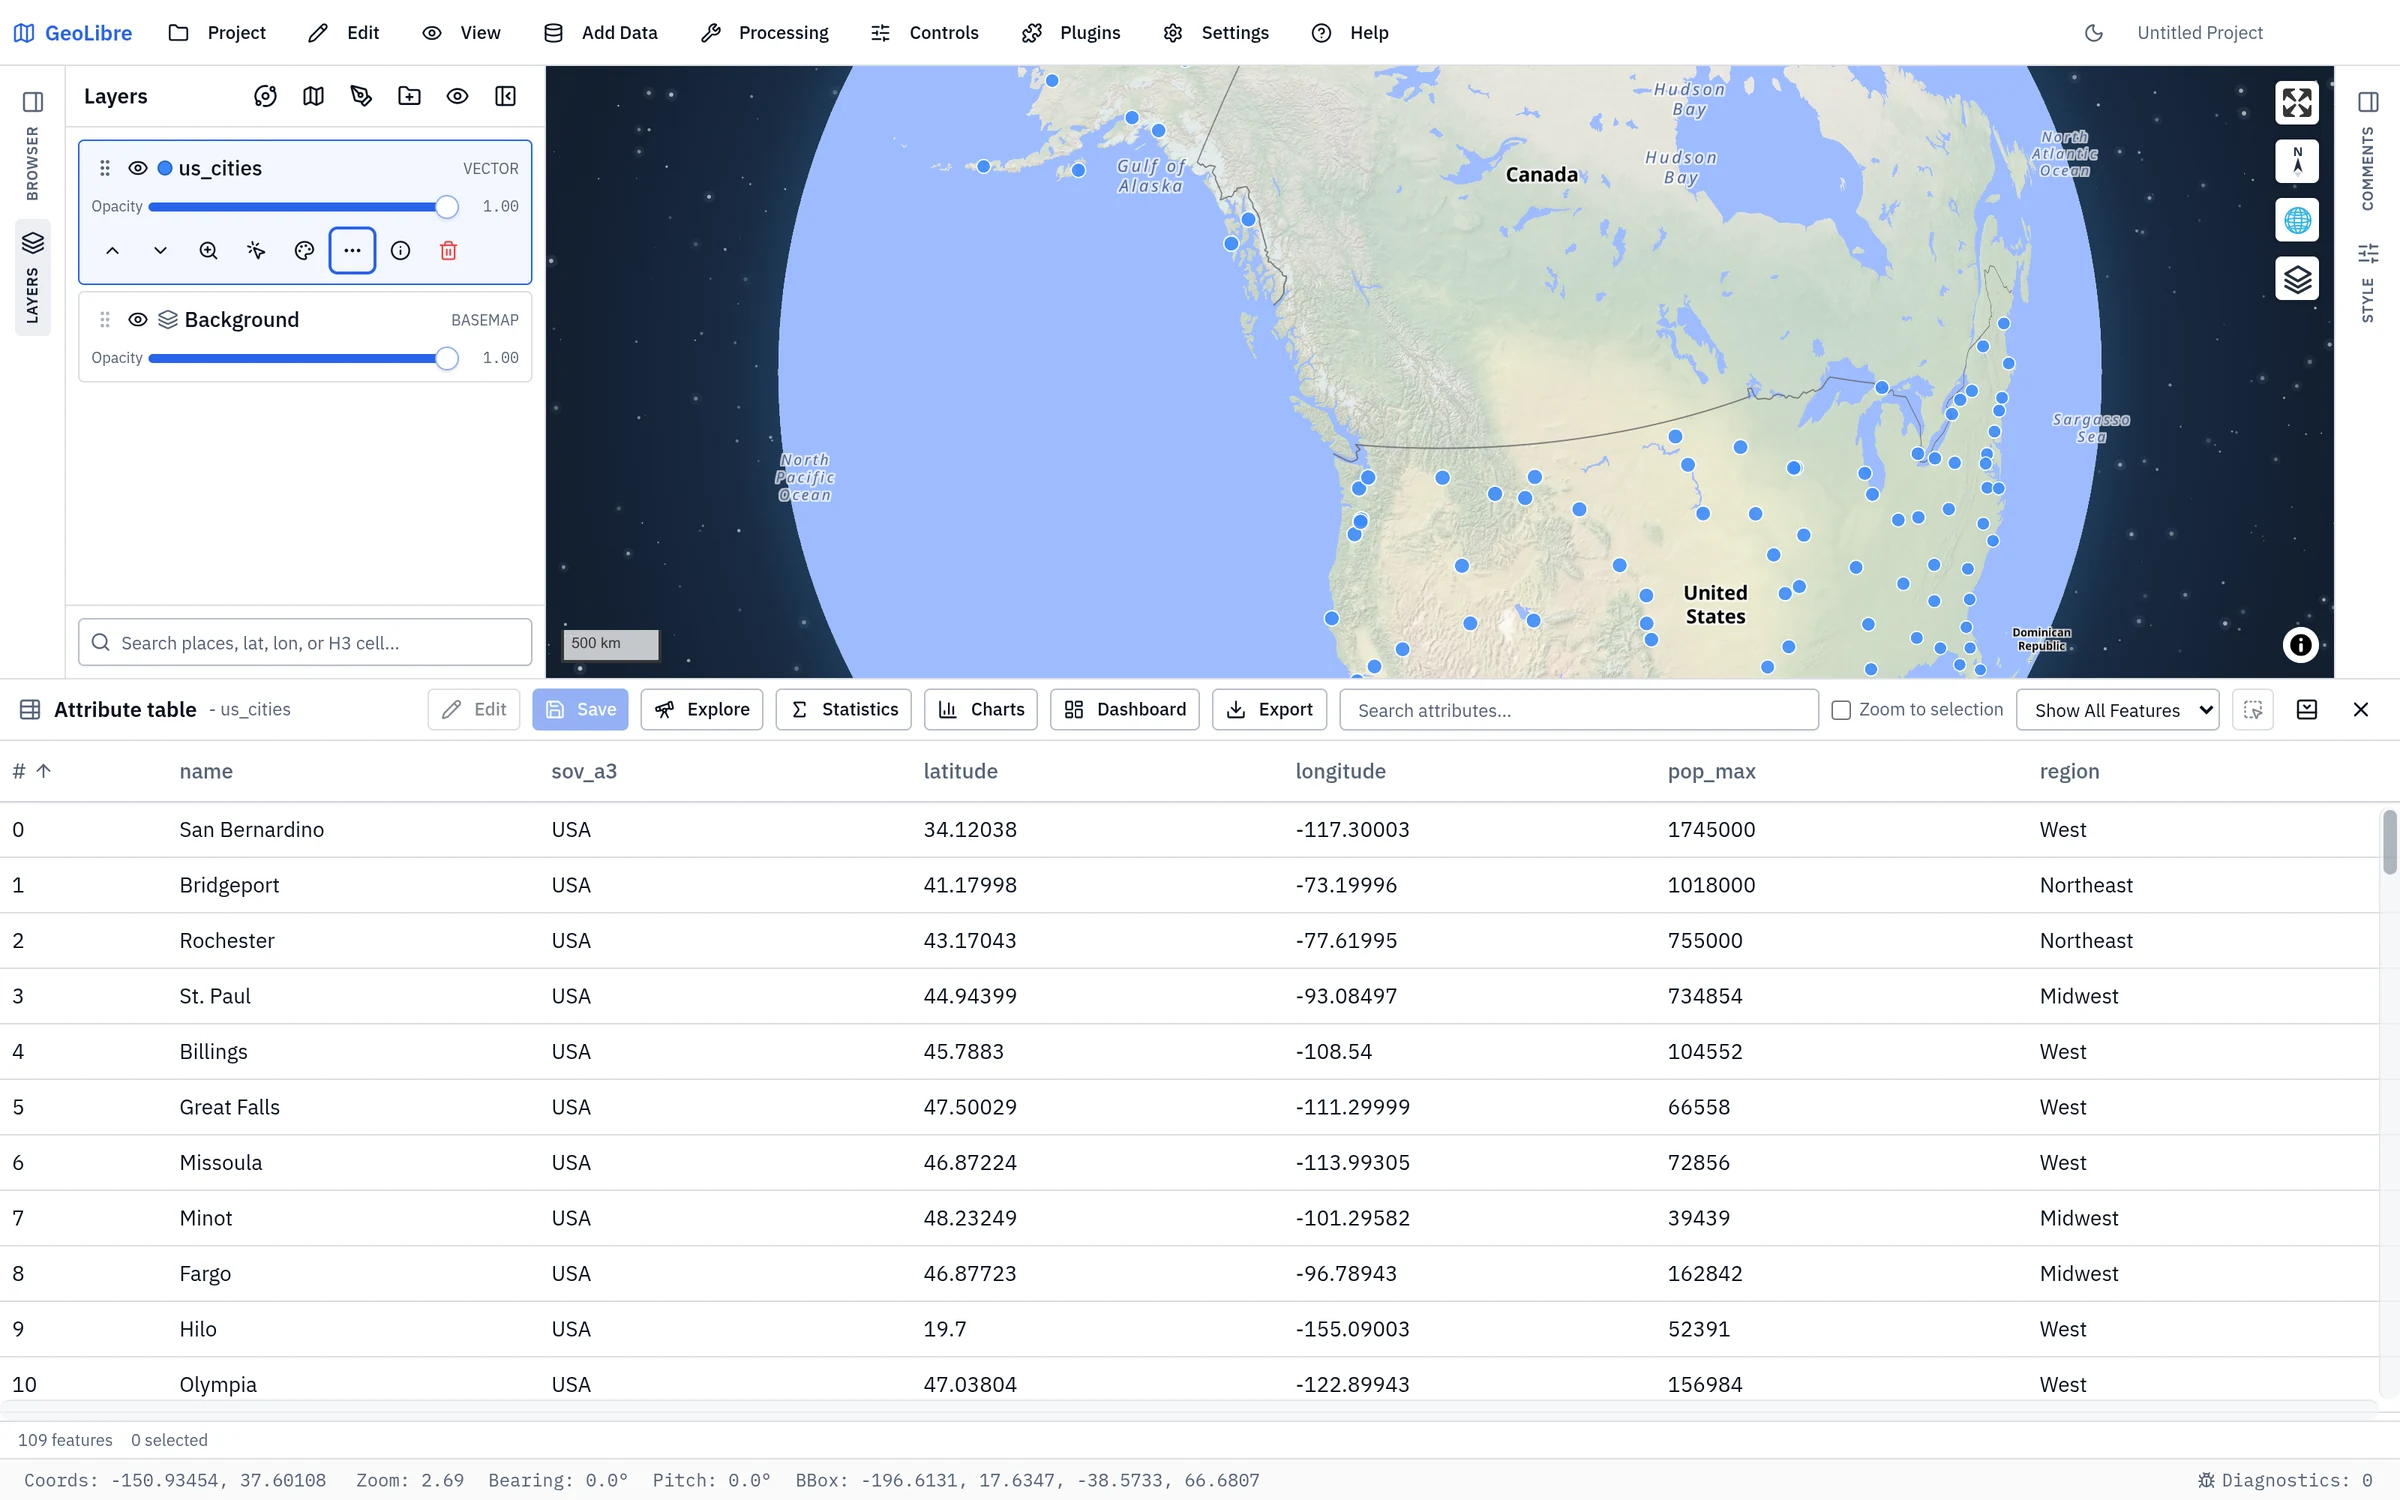
- Click Attribute table on the status bar to expand it, then select the
countrieslayer to load its records. See Attribute Table. - Sort by a column, or type in Search attributes to find a feature. Selecting a row highlights it on the map.
- Click Explore to profile every field at once — its type, how complete it is, and how its values are distributed.
- You can also turn on Identify features for the layer and click a country on the map to see its attributes in a popup.
5. Save or share
- Use Project → Save to write a
.geolibre.jsonfile. The desktop app saves to disk; the browser build uses the browser's save dialog where it has one and otherwise downloads the file. See Projects. - Anywhere, use Project → Share to upload the project and get a public link. See Sharing & Embedding.
Next steps
- Load cloud-native and remote formats in Cloud-Native Data.
- Run geometry tools in Vector Analysis.
- Query your data in Spatial SQL.