
 Qiusheng Wuandgithub-actions[bot]
5ecb05760e
* docs: correct the user guide against the running app and add screenshots

Several pages had drifted from the shipped UI: the toolbar was documented as
seven menus with Edit and View missing entirely, Add Data omitted ten entries,
the plugin and style-type lists were from an older release, and the terrain
tutorial claimed raster tools need the desktop app when eight of them have a
browser engine. Every claim here was rechecked by driving the app, and the
Browser panel, Model Builder, Dashboard, and the attribute table's own tools
are now documented rather than only mentioned in the feature list.

* fix(mkdocs): update GeoLibre Web link in documentation

* Address Claude review feedback

- Correct the `C` shortcut row: it toggles the review-comment tool and the
  pin lands where you click next, not at the map center. Also mention the
  shortcut in the Review comments section, which only documented the panel.
- Give Managing Layers its own Layers-panel screenshot instead of reusing
  the full-workspace shot from Interface Overview, which did not match the
  alt text.

* Address CodeRabbit review feedback

- Name both projection-aware engines in the buffer tip. Python (Pyodide)
  runs the same GeoPandas path as the sidecar and is the one available on
  the web build, so pointing only at the sidecar sends web users nowhere.
- Stop claiming every on-map-control plugin has a positioning submenu.
  Flight Simulator and SamGeo toggle directly, and Web Services and DGGS
  open a list of sub-plugins instead.

* Update mkdocs.yml

Co-authored-by: github-actions[bot] <41898282+github-actions[bot]@users.noreply.github.com>

---------

Co-authored-by: github-actions[bot] <41898282+github-actions[bot]@users.noreply.github.com>
3.9 KiB
Vector Analysis
This tutorial runs a small vector workflow: buffer a layer, overlay it with another, and export the result. It uses the Vector tools under Processing → GeoLibre Toolbox → Vector.
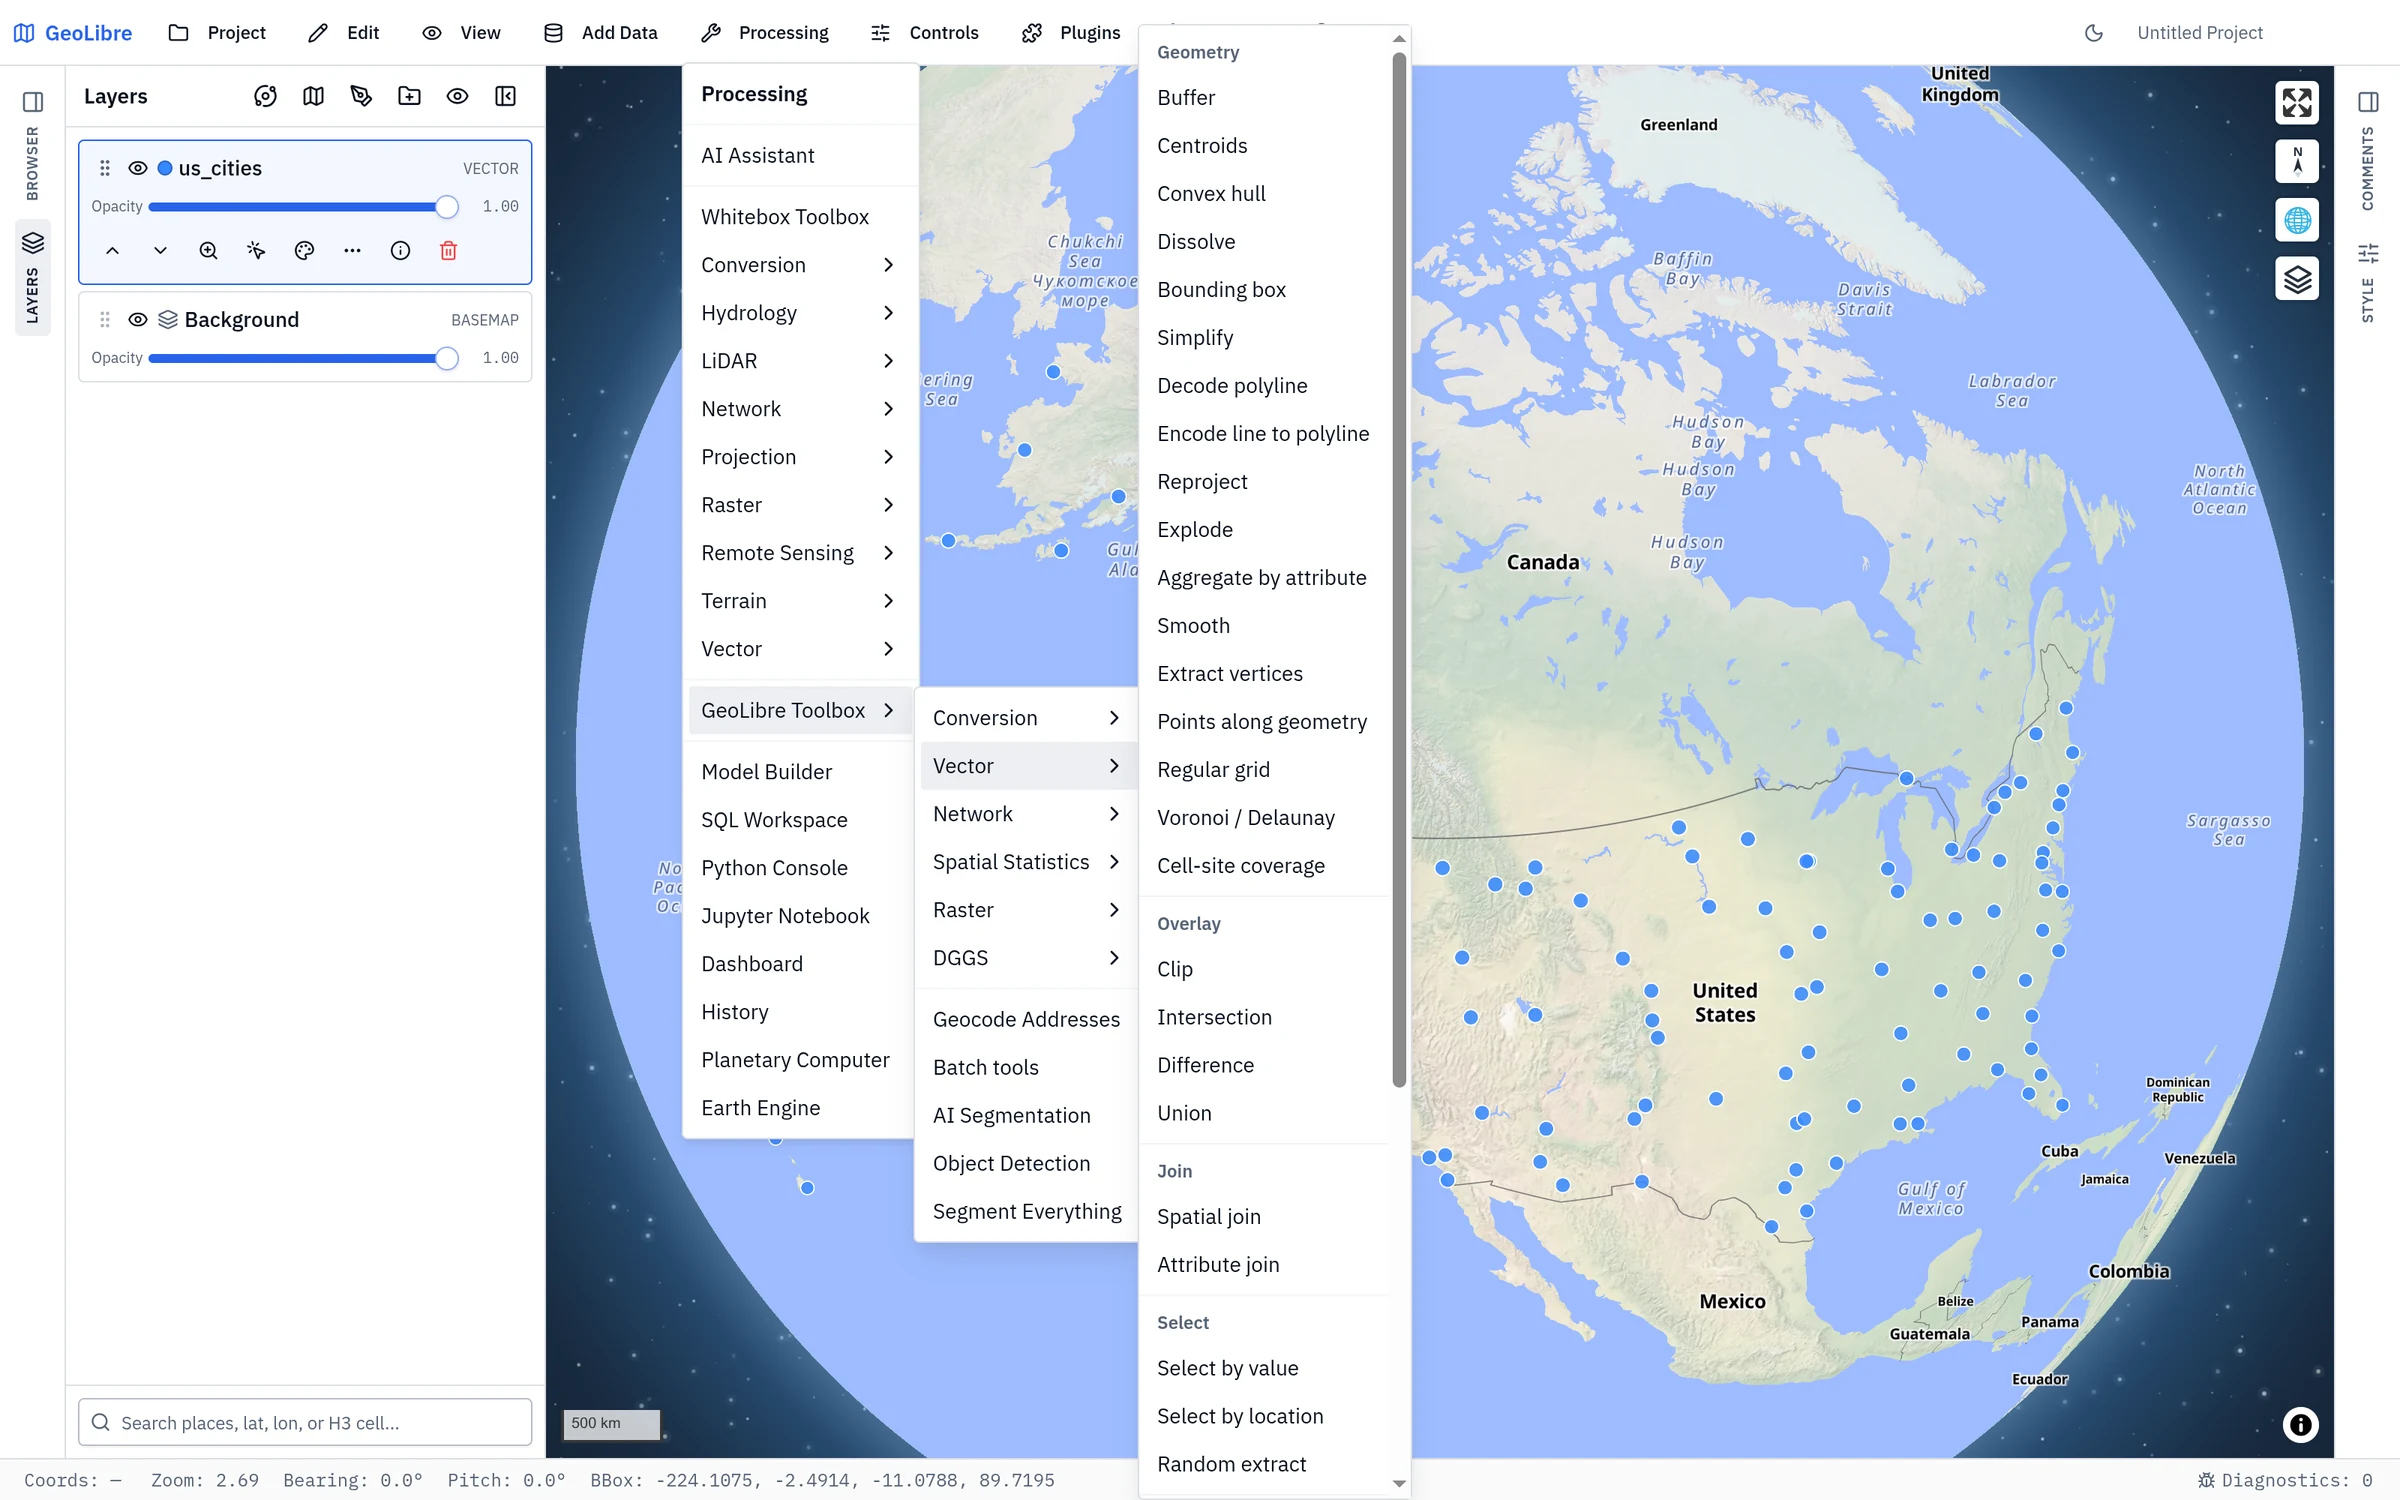
!!! note "Two toolboxes share this menu" Processing → Vector (above the separator) is the Whitebox catalog's vector category; Processing → GeoLibre Toolbox → Vector is the dialog this tutorial uses. See Two toolboxes in one menu.
1. Load input data
Add at least one vector layer (see Adding Data). For an overlay you will need two layers, for example a set of points or lines and a polygon layer to clip against.
2. Buffer a layer
- Open Processing → GeoLibre Toolbox → Vector → Buffer.
- Set Input layer to your layer.
- Set the Distance and Units (kilometers, meters, or miles).
- Choose an Engine:
- Client (Turf.js) runs in the browser with no setup.
- Sidecar (GeoPandas) runs on the Python sidecar for projection-aware distances (desktop app).
- Python (Pyodide) runs the same GeoPandas code as the sidecar, but in your browser, so the results match the sidecar without one being installed. The runtime downloads once on first use.
- Click Run. A buffered layer is added to the map.
!!! tip "Projection-aware distances" The client engine buffers in geographic coordinates. For accurate metric distances over large areas, use one of the two GeoPandas engines, which reproject before buffering: Sidecar (GeoPandas) on the desktop app, or Python (Pyodide) anywhere, including the web build.
3. Overlay two layers
With the buffer (or any polygon layer) and a second layer, run an overlay:
- Clip keeps the part of the input that falls inside the overlay, preserving the input's attributes.
- Intersection keeps only the overlapping areas of two polygon layers.
- Difference removes the overlay's area from the input.
- Union merges two polygon layers into one (attributes are not preserved, on either engine).
- Spatial join attaches a join layer's attributes to each input feature based on a spatial relationship (intersects, within, or contains) — for example, tagging each point with the polygon that contains it. Works with any geometry type.
- Attribute join attaches a join table's attributes to each input feature where a key field matches — no geometry involved (for example, joining census statistics to boundary polygons by a shared FIPS code). It is one-to-one (the first matching join row wins); pick the key field on each side, optionally list which fields to bring over, and choose an inner or left join.
Open the tool from Processing → GeoLibre Toolbox → Vector, pick the input and overlay layers, and Run.
4. Inspect and refine
Open the Attribute table on the result layer to check the output, and adjust its style so it stands out from the inputs. Every run is also recorded in Processing → History, which re-runs an entry with one click and copies the equivalent Python code.
5. Export the result
To save the output as a cloud-native file, use Processing → GeoLibre Toolbox → Conversion (for example Vector to GeoParquet or Vector to FlatGeobuf). See Cloud-Native Data. You can also export records from the Attribute table or the SQL Workspace.
Next steps
- Do the same kind of analysis in SQL with Spatial SQL.
- Move to raster analysis in Terrain Analysis.